Bullish View
- Buy the AUD/USD pair and set a profit take at 0.6250.
- Add a stop-loss at 0.6150.
- Time frame: 1-2 days.
Bearish View
- Sell the AUD/USD pair and set a profit take at 0.6150.
- Add a stop-loss at 0.6250.

The AUD/USD pair continued its strong sell-off as investors embraced the risk-off sentiment by moving to the safety of the US dollar. It fell to a low of 0.6180, its lowest point since 2022 and a few pips above the 2020 low.
The decline in the AUD/USD exchange rate coincided with an uptrend in the US dollar index, which jumped to $109 as the greenback rose against most currencies. This increase is largely due to investors anticipating that the Fed will become increasingly hawkish as Donald Trump’s policies begin to take shape.
Trump has made several promises, including immigration, tariffs and tax cuts. He wants to keep his 2017 tax cuts and roll out newer ones. Such a move, if the law is adopted, will lead to higher inflation in the long run.
The most significant move to trigger inflation will be the upcoming tariffs, which Trump hopes will help reduce the trade deficit. The reality is that US importers will raise prices because it will become incredibly expensive to manufacture in the US.
Furthermore, the AUD/USD pair retreated on growing prospects that the Reserve Bank of Australia (RBA) will adopt a more dovish tone this year. In contrast to other central banks, the RBA maintained a very hawkish tone as it left interest rates unchanged in 2024. With economic growth slowing down, there are chances that RBA will start reducing interest rates this year.
The Federal Reserve, on the other hand, has indicated that it will be more hawkish this year because the US economy is doing well. He indicated that this year he will achieve only two reductions, less than the previously expected 4.
This week’s US jobs numbers will provide more information on the labor market. Economists expect the data to show that the unemployment rate remained at 4.2% in December.
AUD/USD technical analysis
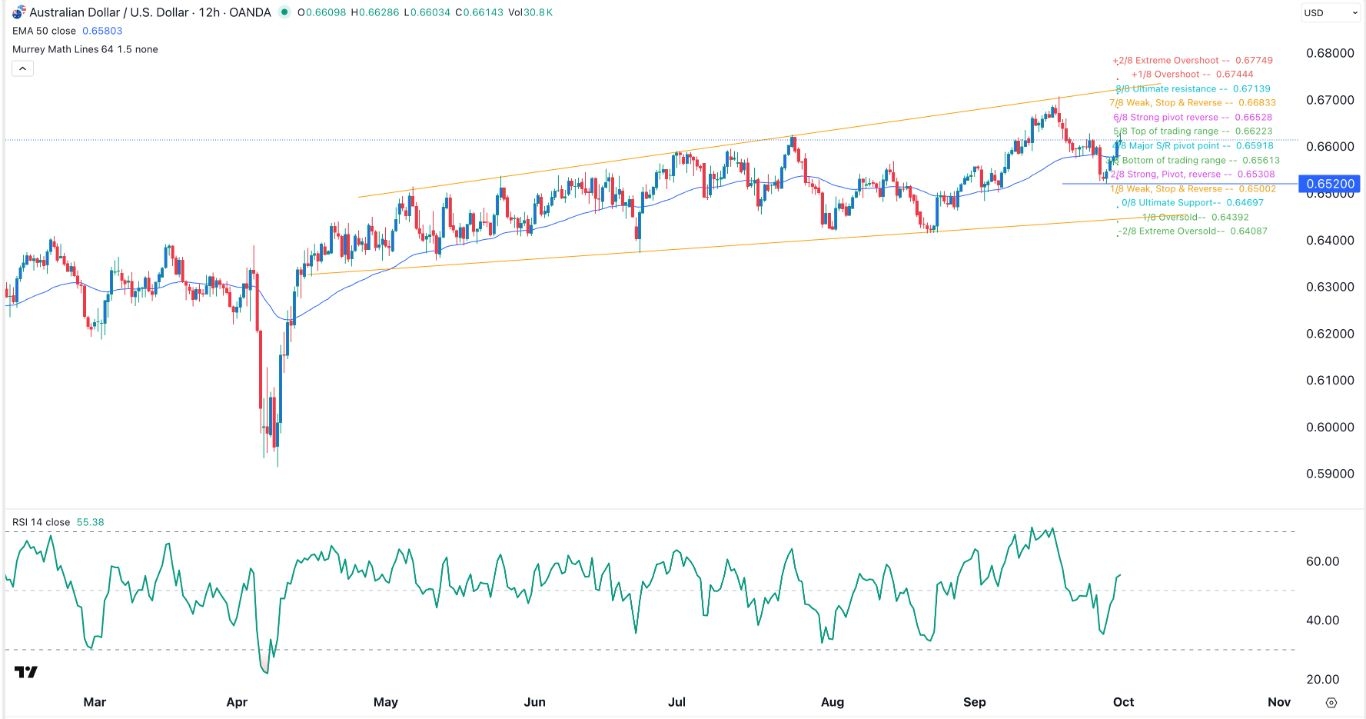
The daily chart shows that the AUD/USD pair has been in a strong bearish trend for the past few months. It recently fell and moved below the important support at 0.6363, which is the low level of April and August last year.
The pair remained below the 50-day and 20-day exponential moving averages (EMA), a sign that the bears are in control. It also formed a falling wedge chart, a popular reversal sign.
Therefore, the pair can bounce back when the bulls target the next point at 0.6250. A break below support at 0.6180 will invalidate the bullish view.
Ready to trade our daily Forex signals? Here is a list of some of the best Forex platforms in Australia for you to check out.
